
tl;dr: If you just want to quickly get stats for a repo, you can find the app here. The rest of this post explains how it’s built with Mavo HTML, CSS, and 0 lines of JS. Or, if you’d prefer, you can just View Source — it’s all there!
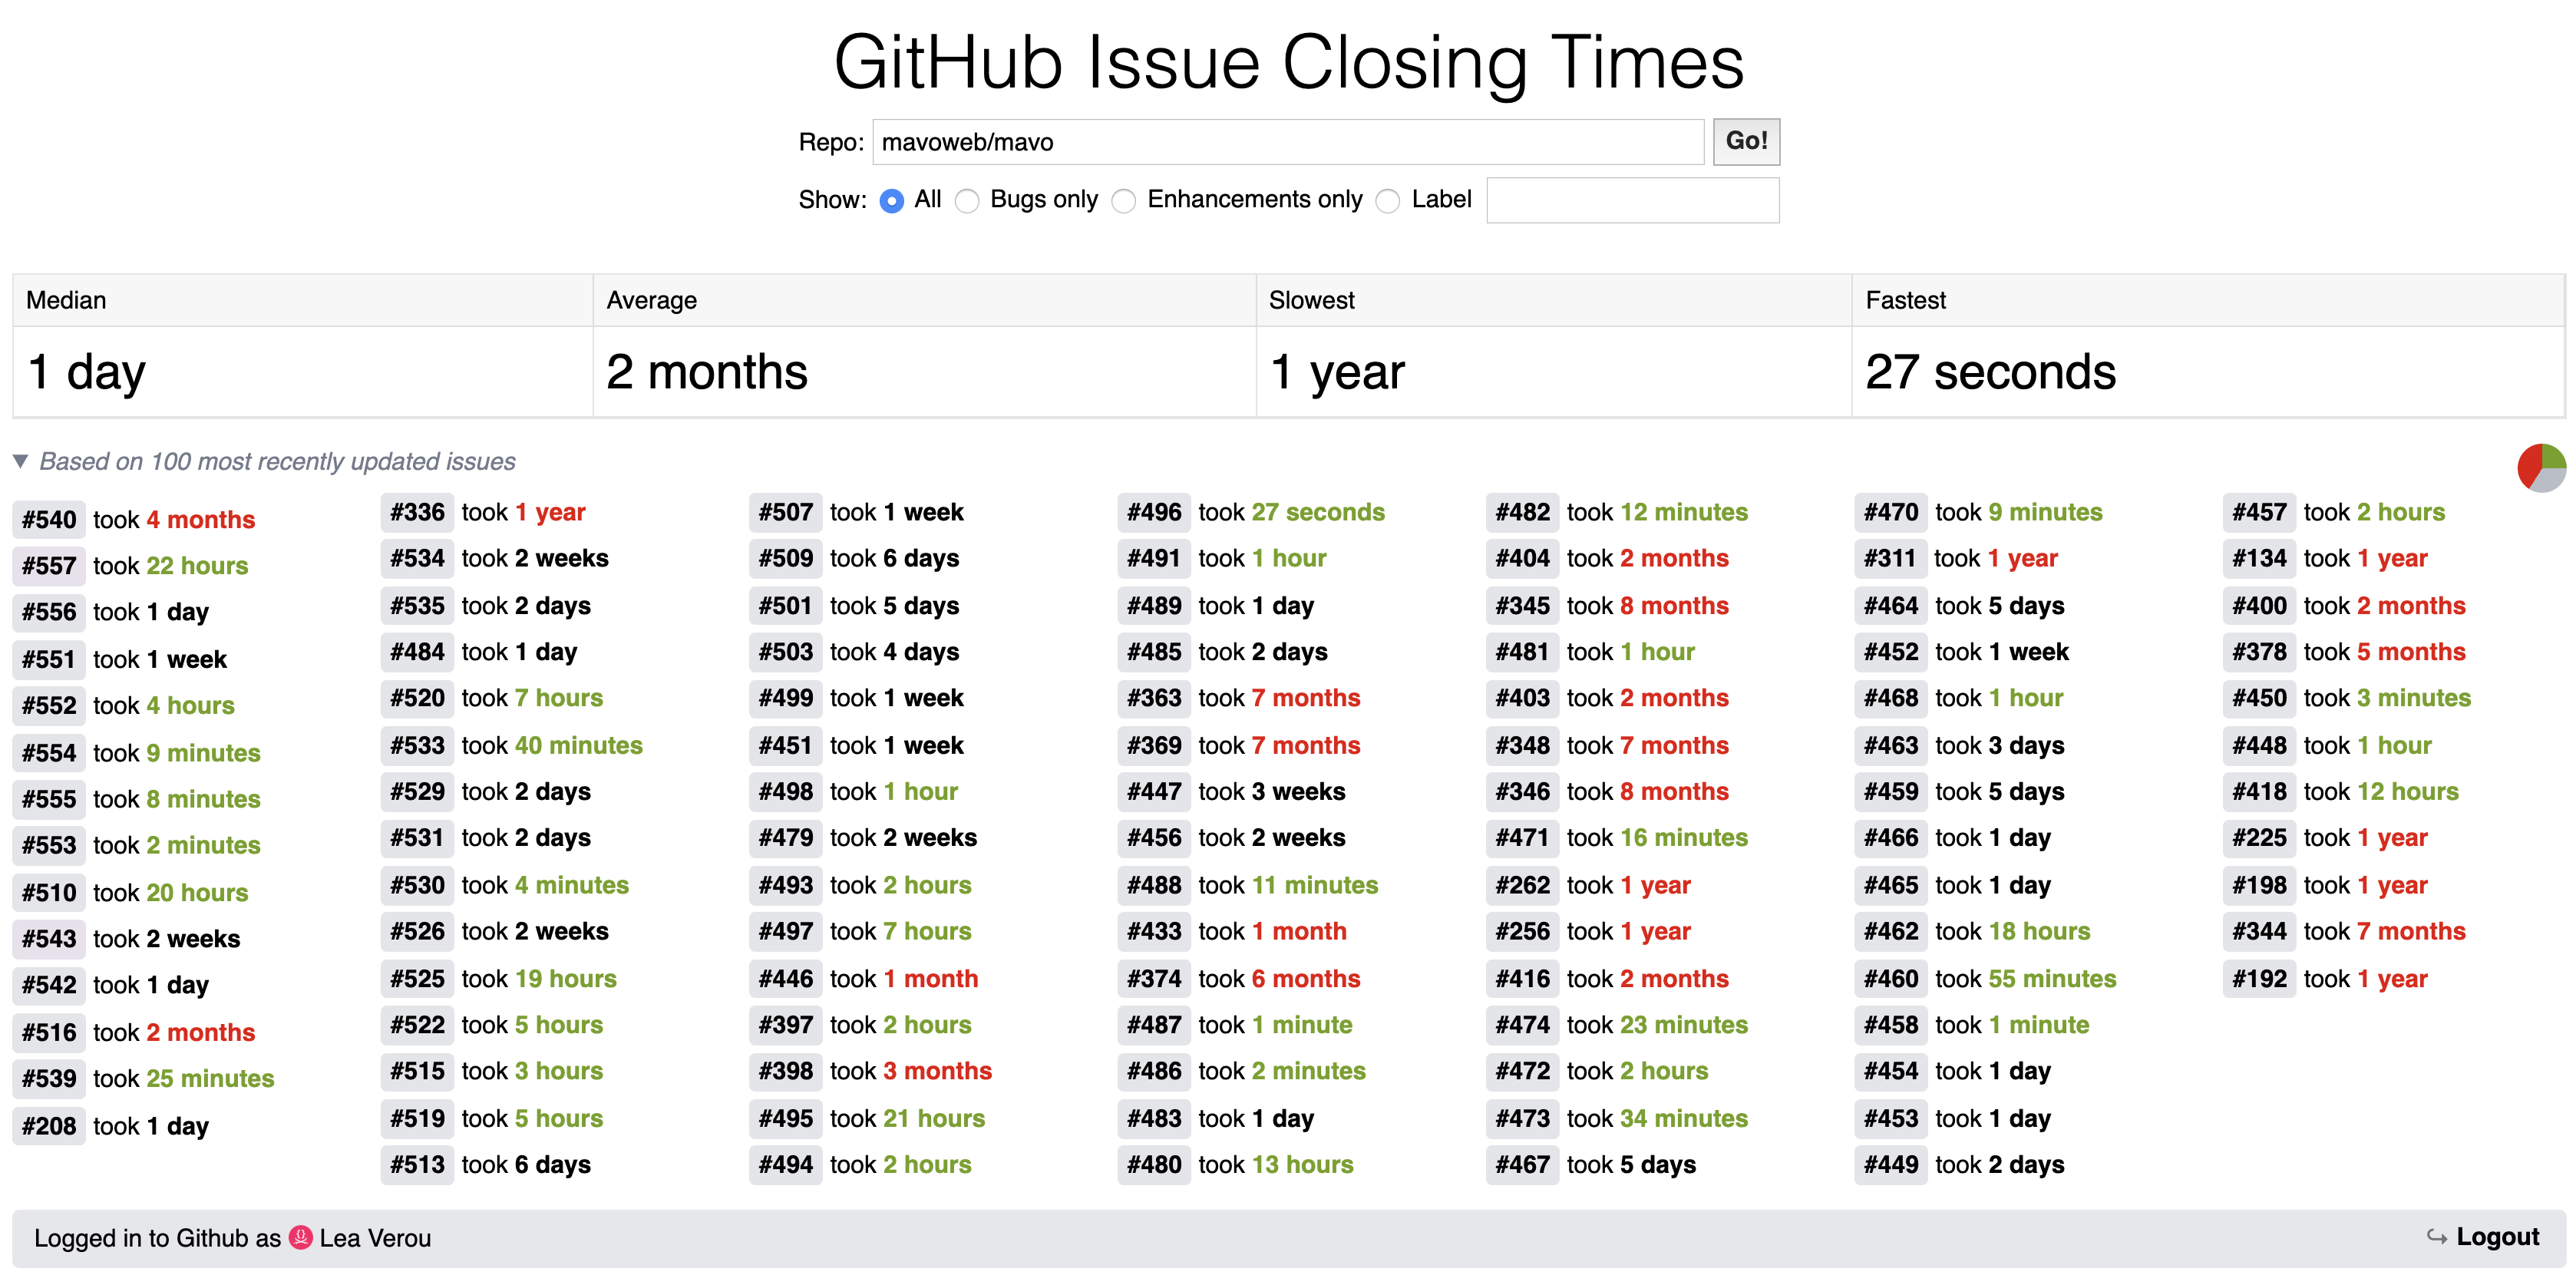
The finished app we’re going to make, find it at https://projects.verou.me/issue-closing
One of the cool things about Mavo is how it enables one to quickly build apps that utilize the Github API. At some point I wanted to compute stats about how quickly (or rather, slowly…) Github issues are closed in the Mavo repo. And what better way to build this than a Mavo app? It was fairly easy to build a prototype for that.
Displaying a list of the last 100 closed issues and the time it took to close them
To render the last 100 closed issues in the Mavo app, I first looked up the appropriate API call in Github’s API documentation, then used it in the mv-source attribute on the Mavo root, i.e. the element with mv-app that encompasses everything in my app:
<div mv-app="issueClosing"
     mv-source="https://api.github.com/repos/mavoweb/mavo/issues?state=closed&sort=updated&per_page=100"
     mv-mode="read">
	<!-- app here -->
</div>
Then, I displayed a list of these issues with:
<div mv-multiple property="issue">
	<a class="issue-number" href="https://github.com/mavoweb/mavo/issues/[number]" title="[title]" target="_blank">#[number]</a>
	took [closed_at - created_at] ms
</div>
See the Pen Step 1 - Issue Closing App Tutorial by Lea Verou (@leaverou) on CodePen.
This would work, but the way it displays results is not very user friendly (e.g. “#542 took 149627000 ms”). We need to display the result in a more readable way.
We can use the duration() function to display a readable duration such as “1 day”:
<div mv-multiple property="issue">
	<a class="issue-number" href="https://github.com/mavoweb/mavo/issues/[number]" title="[title]" target="_blank">#[number]</a>
	took [duration(closed_at - created_at)]
</div>
See the Pen Step 2 - Issue Closing App Tutorial by Lea Verou (@leaverou) on CodePen.
Displaying aggregate statistics
However, a list of issues is not very easy to process. What’s the overall picture? Does this repo close issues fast or not? Time for some statistics! We want to calculate average, median, minimum and maximum issue closing time. To calculate these statistics, we need to use the times we have displayed in the previous step.
First, we need to give our calculation a name, so we can refer to its value in expressions:
<span property="timeToClose">[duration(closed_at - created_at)]</span>
However, as it currently stands, the value of this property is text (e.g. “1 day”, “2 months” etc). We cannot compute averages and medians on text! We need the property value to be a number. We can hide the actual raw value in an attribute and use the nicely formatted value as the visible content of the element, like so (we use the content attribute here but you can use any, e.g. a data-* attribute would work just as well):
<span property="timeToClose" mv-attribute="content" content="[closed_at - created_at]">[duration(timeToClose)]</span>
Note: There is a data formatting feature in the works which would simplify this kind of thing by allowing you to separate the raw value and its presentation without having to use separate attributes for them.
We can also add a class to color it red, green, or black depending on whether the time is longer than a month, shorter than a day, or in-between respectively:
<span property="timeToClose" mv-attribute="content" content="[closed_at - created_at]" class="[if(timeToClose > month(), 'long', if (timeToClose < day(), 'short'))]">[duration(timeToClose)]</span>
Now, on to calculate our statistics! We take advantage of the fact that timeToClose outside the issue collection gives us all the times, so we can compute aggregates on them. Therefore, the stats we want to calculate are simply average(timeToClose), median(timeToClose), min(timeToclose), and max(timeToClose). We put all these in a definition list:
<dl>
	<dt>Median</dt>
	<dd>[duration(median(timeToClose))]</dd>
	<dt>Average</dt>
	<dd>[duration(average(timeToClose))]</dd>
	<dt>Slowest</dt>
	<dd>[duration(max(timeToClose))]</dd>
	<dt>Fastest</dt>
	<dd>[duration(min(timeToClose))]</dd>
</dl>
See the Pen Step 3 - Issue Closing App Tutorial by Lea Verou (@leaverou) on CodePen.
Making repo a variable
Now that all the functionality of my app was in place, I realized this could be useful for more repos as well. Why not make the repo a property that can be changed? So I added an input for specifying the repo: <input property="repo" mv-default="mavoweb/mavo"> and then replaced mavoweb/mavo with [repo] everywhere else, i.e. mv-source became https://api.github.com/repos/[repo]/issues?state=closed&sort=updated&per_page=100.
Avoid reload on every keystroke
This worked, but since Mavo properties are reactive, it kept trying to reload data with every single keystroke, which was annoying and wasteful. Therefore, I needed to do a bit more work so that there is a definite action that submits the change. Enter Mavo Actions!
I created two properties: repo for the actual repo and repoInput for the input. repoInput still changes on every keystroke, but it’s repo that is actually being used in the app. I wrapped the input with a <form> and added an action on the form that does this (mv-action="set(repo, repoInput)"). I also added a submit button. Since Mavo actions on forms are triggered when the form is submitted, it doesn’t matter if I press Enter on the input, or click the Submit button, both work.
Setting the repo via a URL parameter
Eventually I also wanted to be able to set the repo from the URL, so I also added a hidden repoDefault property: <meta property="repoDefault" content="[url('repo') or 'mavoweb/mavo']">, and then changed the hardcoded mv-default="mavoweb/mavo" to mv-default="[repoDefault]" on both the repo and the repoInput properties. That way one can link to stats for a specific repo, e.g. https://projects.verou.me/issue-closing/?repo=prismjs/prism
Why a repoDefault property and not just mv-default="[url('repo') or 'mavoweb/mavo']? Just keeping things DRY and avoiding having to repeat the same expression twice.
See the Pen Step 5 - Issue Closing App Tutorial by Lea Verou (@leaverou) on CodePen.
Filtering by label
At some point I wondered: What would the issue closing times be if we only counted bugs? What if we only counted enhancements? Surely these would be different: When looking at issue closing times for a repo, one primarily cares about how fast bugs are fixed, not how quickly every random feature suggestion is implemented. Wouldn’t it be cool to also have a label filter?
For that, I added a series of radio buttons:
Show:
<label><input type="radio" property="labels" name="labels" checked value=""> All</label>
<label><input type="radio" name="labels" value="bug"> Bugs only</label>
<label><input type="radio" name="labels" value="enhancement"> Enhancements only</label>
Then, I modified mv-source to also use this value in its API call: mv-source="https://api.github.com/repos/[repo]/issues?state=closed&sort=updated&labels=[labels]&per_page=100".
Note that when turning radio buttons into a Mavo property you only use the property attribute on the first one. This is important because Mavo has special handling when you use the property attribute with the same name multiple times in the same group, which we don’t want here. You can add the property attribute on any of the radio buttons, it doesn’t have to be the first. Just make sure it’s only one of them.
Then I became greedy: Why not also allow filtering by custom labels too? So I added another radio with an input:
Show:
<label><input type="radio" property="labels" name="labels" checked value=""> All</label>
<label><input type="radio" name="labels" value="bug"> Bugs only</label>
<label><input type="radio" name="labels" value="enhancement"> Enhancements only</label>
<label><input type="radio" name="labels" value="[customLabel]"> Label <input property="customLabel"></label>
Note that since this is a text field, when the last value is selected, we’d have the same problem as we did with the repo input: Every keystroke would fire a new request. We can solve this in the same way as we solved it for the repo property, by having an intermediate property and only setting labels when the form is actually submitted:
Show:
<label><input type="radio" property="labelFilter" name="labels" checked value=""> All</label>
<label><input type="radio" name="labels" value="bug"> Bugs only</label>
<label><input type="radio" name="labels" value="enhancement"> Enhancements only</label>
<label><input type="radio" name="labels" value="[customLabel]"> Label <input property="customLabel"></label>
<meta property="labels" content="">
Adding label autocomplete
Since we now allow filtering by a custom label, wouldn’t it be cool to allow autocomplete too? HTML allows us to offer autocomplete in our forms via <datalist> and we can use Mavo to populate the contents!
First, we add a <datalist> and link it with our custom label input, like so:
<label><input type="radio" name="labels" value="[customLabel]"> Label <input property="customLabel" list="label-suggestions"></label>
<datalist id="label-suggestions">
</datalist>
Currently, our suggestion list is empty. How do we populate it with the labels that have actually been used in this repo? Looking at the API documentation, we see that each returned issue has a labels field with its labels as an object, and each of these objects has a name field with the textual label. This means that if we use issue.labels.name in Mavo outside of the issues collection, we get a list with all of these values, which we can then use to populate our <datalist> by passing it on to mv-value which allows us to create dynamic collections:
<label><input type="radio" name="labels" value="[customLabel]"> Label <input property="customLabel" list="label-suggestions"></label>
<datalist id="label-suggestions">
	<option mv-multiple mv-value="unique(issue.labels.name)"></option>
</datalist>
Note that we also used unique() to eliminate duplicates, since otherwise each label would appear as many times as it is used.
See the Pen Issue Closing App - Tutorial Step 6 by Lea Verou (@leaverou) on CodePen.
Adding a visual summary graphic
Now that we got the functionality down, we can be a little playful and add some visual flourish. How about a bar chart that summarizes the proportion of long vs short vs normal closing times? We start by setting the CSS variables we are going to need for our graphic, i.e. the number of issues in each category:
<summary style="--short: [count(timeToClose < day())]; --long: [count(timeToClose > month())]; --total: [count(issue)];">
	Based on [count(issue)] most recently updated issues
</summary>
Then, we draw our graphic:
summary::before {
	content: "";
	position: fixed;
	bottom: 0;
	left: 0;
	right: 0;
	z-index: 1;
	height: 5px;
	background: linear-gradient(to right, var(--short-color) calc(var(--short, 0) / var(--total) * 100%), hsl(220, 10%, 75%) 0, hsl(220, 10%, 75%) calc(100% - var(--long, 0) / var(--total) * 100%), var(--long-color) 0) bottom / auto 100% no-repeat border-box;
}
Now, wouldn’t it be cool to also show a small pie chart next to the heading, if conic gradients are supported so we can draw it? The color stops would be the same, so we define a --summary-stops variable on summary, so we can reuse them across both gradients:
summary {
	--summary-stops: var(--short-color) calc(var(--short, 0) / var(--total) * 100%), hsl(220, 10%, 75%) 0, hsl(220, 10%, 75%) calc(100% - var(--long, 0) / var(--total) * 100%), var(--long-color) 0;
}

	summary::before {
		content: "";
		position: fixed;
		bottom: 0;
		left: 0;
		right: 0;
		z-index: 1;
		height: 5px;
		background: linear-gradient(to right, var(--summary-stops)) bottom / auto 100% no-repeat border-box;
	}

	@supports (background: conic-gradient(red, red)) {
		summary::after {
			content: "";
			display: inline-block;
			vertical-align: middle;
			width: 1.2em;
			height: 1.2em;
			margin-left: .3em;
			border-radius: 50%;
			background: conic-gradient(var(--summary-stops));
		}
	}
See the Pen Issue Closing App - Tutorial Step 7 by Lea Verou (@leaverou) on CodePen.